Sonifying a chemical reaction network as a musical composition with kinetic Monte Carlo.

Introduction:
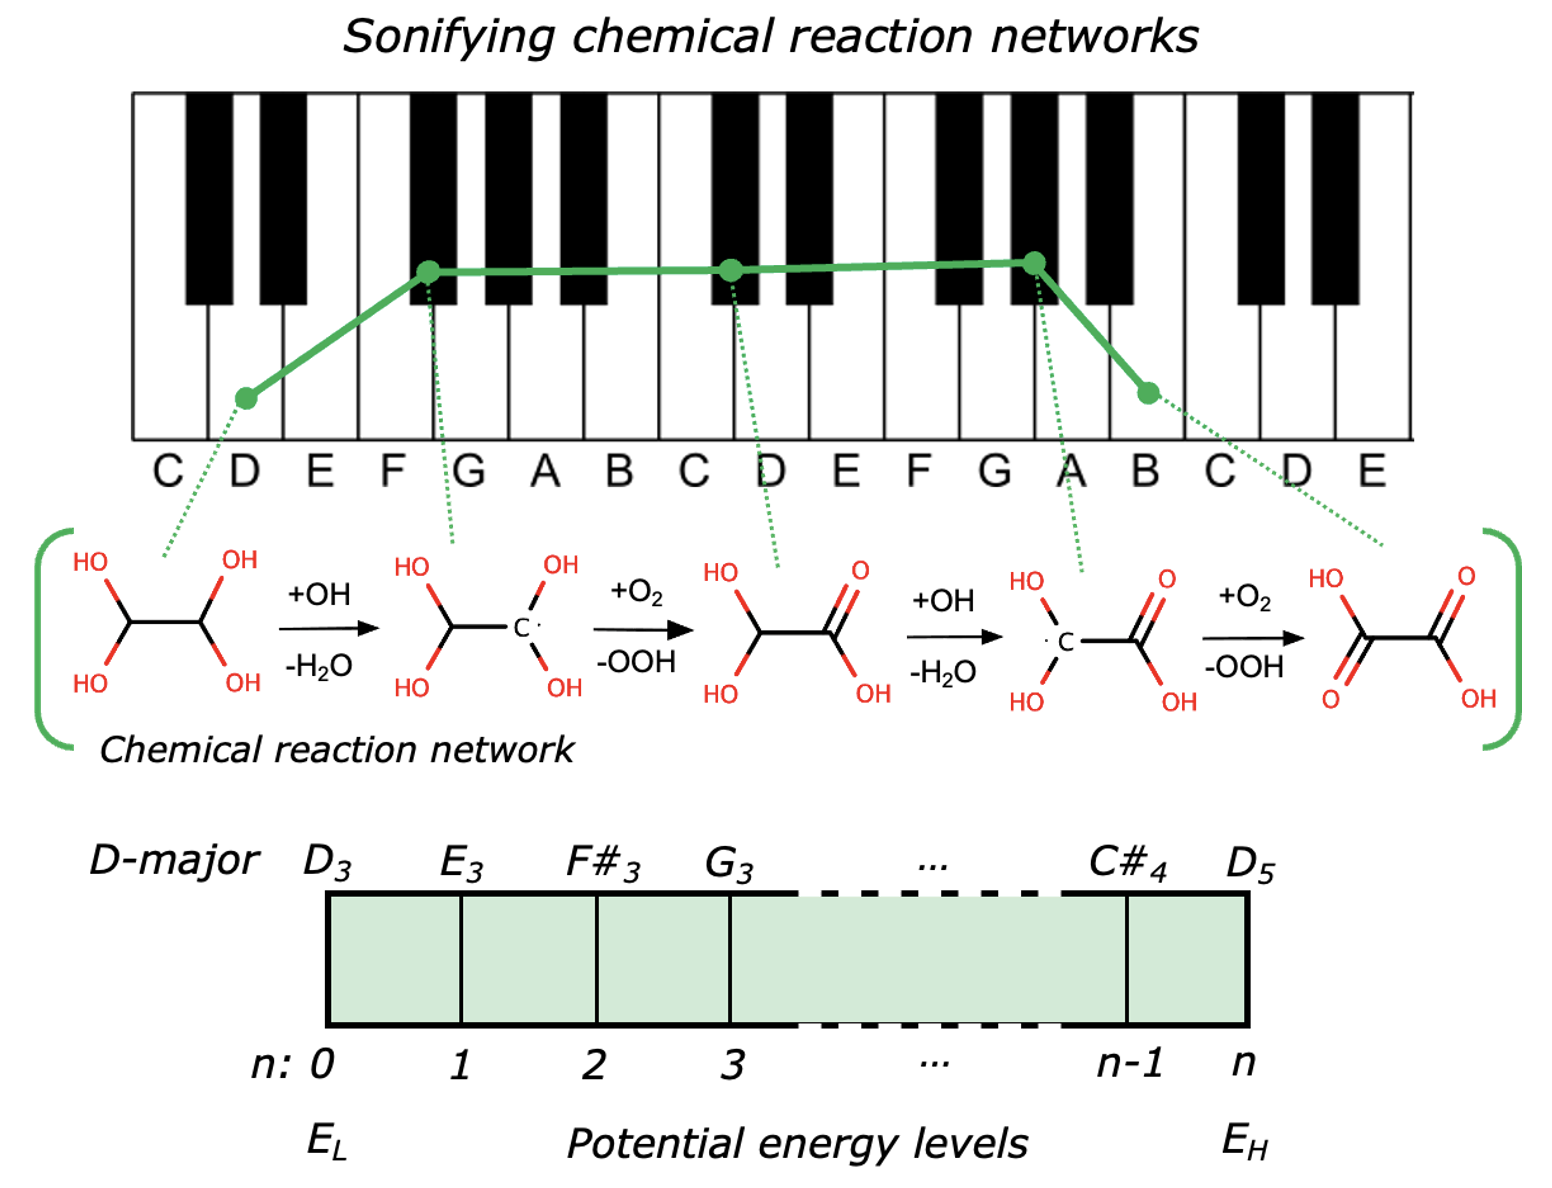
Chemical reactions involve transformations from reactants to products, often passing through numerous chemical intermediates along the way. The set of elementary reaction steps that connect reactants to products through intermediates constitutes a chemical reaction network (e.g. Scheme 1). Trajectories through reaction networks can be constructed using kinetic Monte Carlo (see previous tutorials on https://ari-fischer.github.io/site/). These trajectories are represented as a list of indices corresponding to different states (i.e. species) that the simulated system exists, along with a duration of time that the system exists in one state before transitioning to the next one. Such trajectories are reminiscent of a musical melody, which consists of a list of notes with a corresponding duration that the note is played in sequence.
To complete the analogy between a reaction trajectory and melody requires a mapping between the state of the chemical system and a musical note. Species in a reaction network differ in the molecularity (i.e. the number and types of atoms they contain) and the number and nature of bonds between different atoms. These atomic rearrangements and bond formation/cleavage invariably alter the potential energy of structures along a reaction pathway that connects reactants and products.
Energies of each state in a reaction network (reactants, products, and intermediates) can be assigned a musical note using the following algorithm:
-
Find the highest and lowest energy (EH and EL, respectively) of species in the reaction network.
-
Choose a musical key for the melody (e.g. C-major) and the number of notes (n) to include in the melody.
-
Divide the number energy span (E = EH- EL) into n evenly spaced energy bins. The lower and upper limits for each I of n bins are given by i*E/n+EL and i*E/n+EH, respectively.
-
Assign bins to notes in the selected key in descending order (i.e. higher energies mean lower notes).
-
Assign a note to each species involved in the reaction network by matching its energy level to one of the selected energy bins.
With the energy mapping to musical notes in hand, a sequence of states corresponding to species in the network with durations from a kMC trajectory can be represented as a musical melody. In what follows, an example implementation of the above algorithm combined with a kMC simulation is described (in Python; code provided) to sonify an example reaction network. The result is a melody represented as a MIDI file, which can be imported into a composition software like GarageBand on Mac to play using a vast library of programed instruments.
Sample kinetics musical composition: https://soundcloud.com/ari-fischer-930550194/glyoxal-oxidation-kinetics-sonified
Generating musical composition from kinetic Monte Carlo simulations of a chemical reaction network:
Glyoxal (1; Scheme 1) forms in the atmosphere as a product from the degradation of hydrocarbon pollutants. It enters water droplets in clouds and aerosols where it reacts with OH radicals to form oxalic acid [1,2]. This reaction pathway is important for understanding the earth’s atmosphere and climate, and has been the focus of comprehensive kinetic analysis.
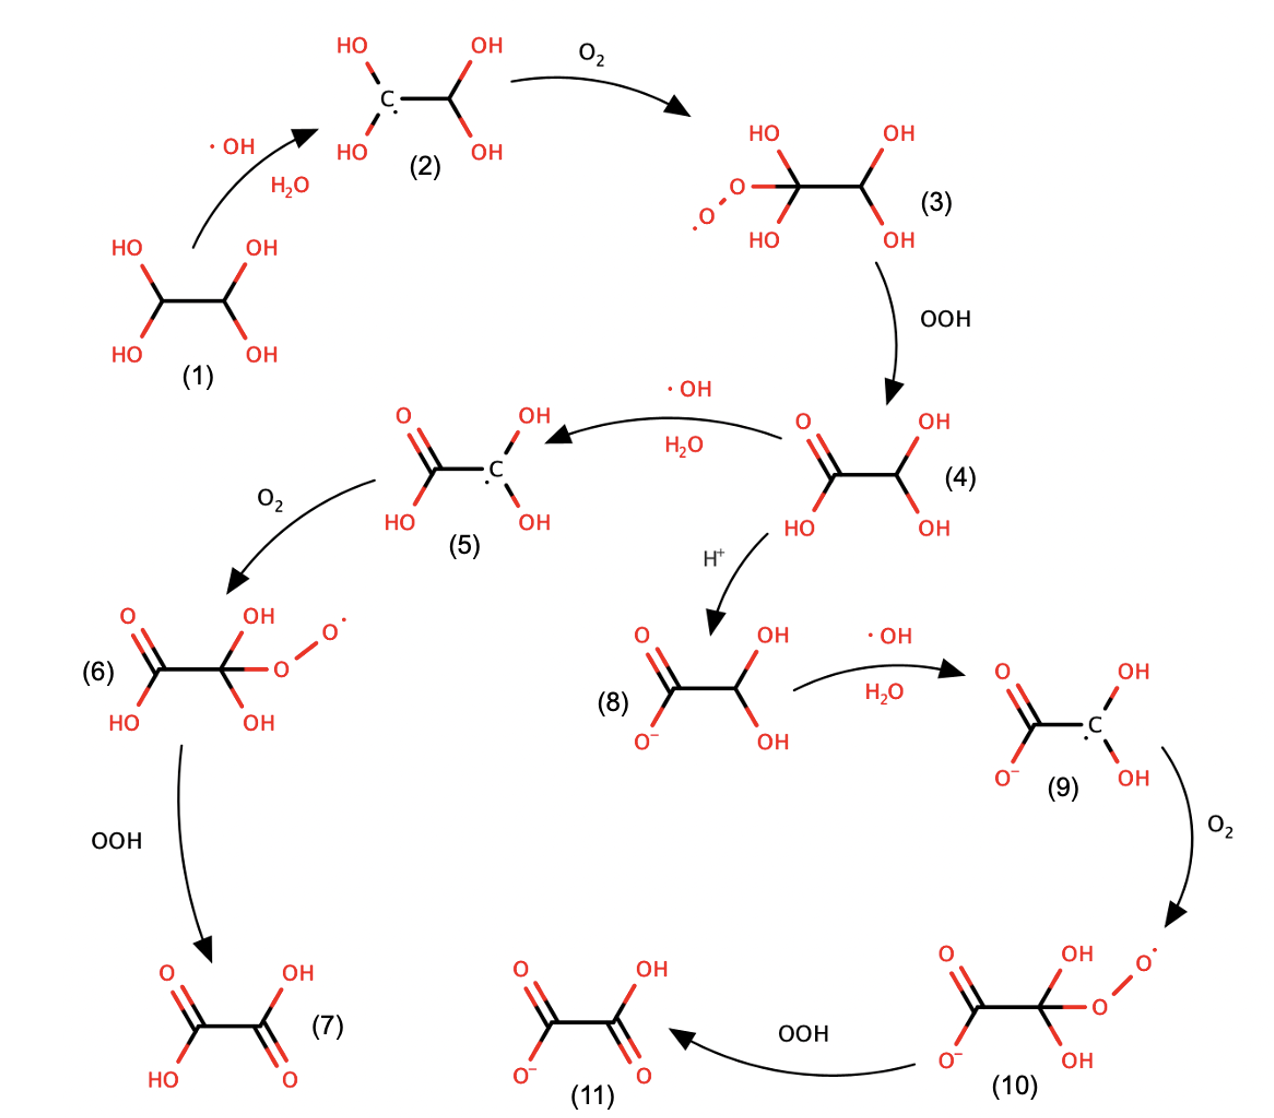
Scheme 1 shows an attenuated model for the reaction of glyoxal in aqueous solutions (e.g. in clouds) adapted from previous studies by Tan et al. [1] and Lim et al. [2]. There are a total of 11 possible intermediates in the mechanism. They are interconverted in a sequence of steps that are mediated by OH radicals and O2. These reactions drive the consumption of glyoxal and the ultimate formation of oxalic acid (7; Scheme 1) and hydrogen oxalate (11; Scheme 1).

Scheme 1: A sequence of elementary steps for the formation of oxalic acid (7) and hydrogen oxalate (11) from glyoxal (1) in aqueous solution in the presence of OH radicals and O2 adapted from [1,2].
To build our melody, we first need to determine the energy associated with each intermediate in the mechanism. Density functional theory (DFT https://en.wikipedia.org/wiki/Density_functional_theory; in the package QChem https://www.q-chem.com/), a mainstay in computational chemistry, was used to calculate the energy of each species, referenced to the initial state, glyoxal, set to 0. The calculated energies are not included in this resource.
Each state can be assigned a musical note in the D major key, also shown in Table 1. To do this, the calculated energy range is divided into 14 equally spaced parts. The energy levels are then assigned to notes in the key of D-major across 2 octaves (between D3 and D5), where an energy of maximum energy of 0 kJ/mol corresponded to the upper bound of D3 and the minimum energy corresponded to the lower bound of C#5. If the DFT energy calculations are too advanced for a user, one can instead assign states to notes in the musical range on some other basis. For instance, one may start with D3 at state 1, and then assign one higher pitch to each subsequent step. In this case, State 1 would be D3, state 2 E3, state 3 F#3, etc.

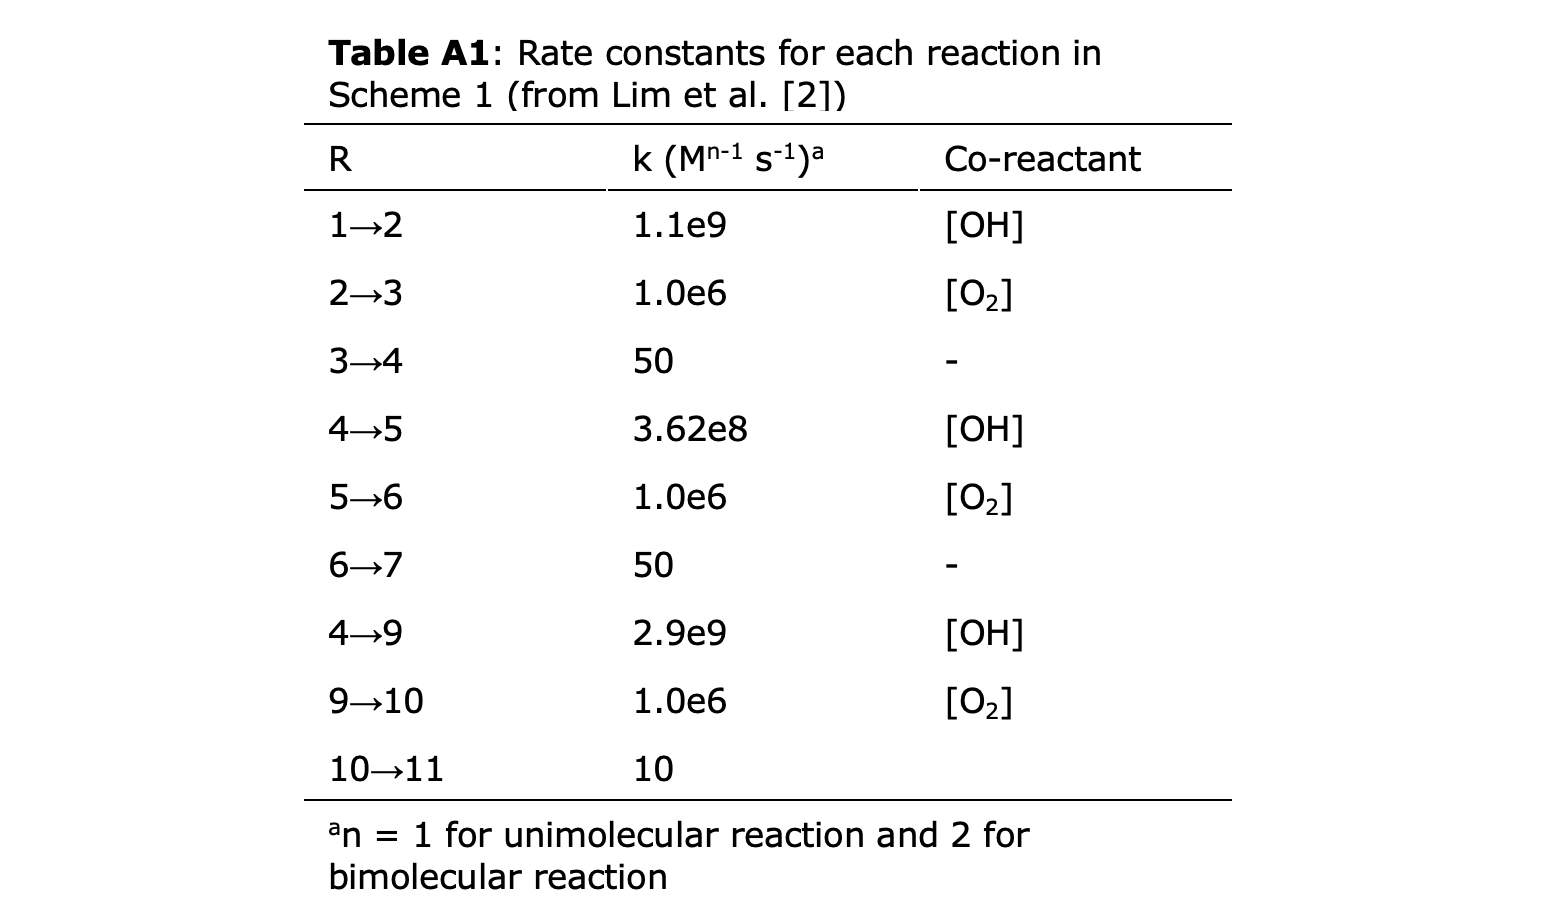
The melody can now by generated from a kMC trajectory using the mapping from states to notes. The kMC simulation requires not only the list of states the system can occupy, but also the transition coefficients from one state to another. Here, we use the kinetic rate constants reported for aqueous glyoxal oxidation by Lim, summarized in Table A1 of the appendix.
A kMC simulation is run to get the trajectory as a sequence of states that the system occupies. Rate constants for the transition from each state to another are taken from Lim et al. [2] and shown in Table A1. The effective rate constants for the steps are re-scaled from a range between 1e-10 and 260 to between 0.8 and 1.2, and the waiting times after simulation are then re-scaled to fall within a range of 0.5 and 2 quarter notes. These scaling procedures ensure that the durations of notes in the melody are more uniform. An example sequence after 40 steps is shown:
[1, 2, 3, 4, 5, 6, 7, 1, 2, 3, 4, 9, 10, 11, 1, 2, 3, 4, 9, 10, 11, 1, 2, 3, 4, 5, 6, 7, 1, 2, 3, 4, 9, 10, 11, 1, 2, 3, 4, 5, 6]
And the corresponding scaled waiting time at each state before each transition given by:
[0.66079755, 0.6608922 , 0.84366544, 0.74437488, 0.77543314,
1.07766031, 1.43336668, 0.57415302, 1.16540856, 1.89982009,
0.66943265, 0.63064583, 0.54025801, 0.81952713, 1.38816434,
0.92015405, 2.00955339, 1.01384846, 2.16103202, 0.73736111,
0.62086153, 0.5678776 , 0.54189736, 0.70768186, 0.68850658,
1.03139227, 1.13199542, 1.51223054, 1.35421892, 0.91010445,
1.42530329, 0.87135698, 1.03829996, 0.65884748, 1.08993699,
1.1119148 , 1.04717635, 1.41443135, 0.79114041, 0.75927701]
Each of the state indices correspond to a note as shown in Table 1. The Python package music21 (http://web.mit.edu/music21/) is used to convert the string of notes resulting from the trajectory and their associated durations into a MIDI file, a format that stores information that can be played by an electronic instrument (https://en.wikipedia.org/wiki/MIDI). An example mp3 file of the sonifyed reaction network was generated by playing the midi representation of the melody using the Shimmering Analog arpeggiator built-in synthesizer, along with an automated drum-beat machine. Using the arpeggiator means that each note from the trajectory file defined the base of a chord that was played as an arpeggio (https://en.wikipedia.org/wiki/Arpeggio).
Sample Code:
The accompanying code can be found on github: https://github.com/ari-fischer/kinetics_tutorial/tree/main
References:
[1] Y. Tan et al., Environ. Sci. Technol. 2009, 43, 8105–8112
[2] Y. B. Lim et al., Atmos. Chem. Phys., 10, 10521–10539, 2010
Image credits: piano keys- https://en.wikipedia.org/wiki/Musical_keyboard, molecular structures-drawn using MarvinSketch (https://chemaxon.com/marvin)
Appendix:
